
matplotlib
Draw scientific plots with matplotlib in moonbit
moon add Kaida-Amethyst/matplotlib@0.1.2
Download zipAuthor
Version
0.1.2
License
Apache-2.0
Last updated
last year
Downloads
28
Dependencies
 README
#❤️ Matplotlib.mbt 🌙
#✨ Project Overview
matplotlib.mbt is an innovative tool built upon python.mbt, empowering developers to harness the capabilities of the powerful Python plotting library, Matplotlib, using the Moonbit language. By doing so, we can leverage Moonbit's robust type safety features and modern language ecosystem to bring a fresh perspective to data visualization.
#🛠️ Environment Setup
Before diving into matplotlib.mbt, please ensure your development environment is properly configured.
#🐍 Python Installation Guide
Important Note: This project requires Python 3.9 or higher. For the best experience, we strongly recommend using the latest stable version.
💡 Recommended: Use Anaconda: For data science and machine learning projects, we highly recommend installing Anaconda. Anaconda is a distribution of Python and conda package manager, which includes many commonly used data science libraries (such as NumPy, SciPy, Matplotlib, etc.), helping you manage Python environments and dependencies more easily.
🐧 Linux (Debian/Ubuntu)
If you are not using Anaconda, please ensure that Python 3.9 or higher and the Python development headers are installed on your system.
sudo apt-get update && sudo apt-get install python3.13 python3.13-dev🍎 macOS (Homebrew)
brew install python@3.13🪟 Windows
- Visit the official Python website
- Download the latest 3.x version installer
- During installation, make sure to check the "Add Python to PATH" option
#📊 Matplotlib Installation
matplotlib.mbt relies on the Python Matplotlib library. You can install it using pip, Python's package installer.
If you do not have Anaconda installed, open your terminal or command prompt and run the following command:
Bash
pip install matplotlibIf you have installed Anaconda, Matplotlib is usually pre-installed. If it's not, you can install it using conda:
Bash
conda install matplotlib#✅ Environment Verification
Verifying your Python version and obtaining the Python development header file path are crucial for the subsequent configuration.
# Check Python version
python3 --version

# Get Python development header file path
python3-config --prefix#⚙️ Project Configuration
Follow these steps to configure your matplotlib.mbt project.
#📦 Adding Dependencies
First, update your package index and install the matplotlib library:
moon update
moon add Kaida-Amethyst/matplotlib
⚠️ Please Note: The current Moonbit package manager might have known issues with pure Native library support, and you might encounter related error messages. Please disregard these for now. The official Moonbit team is actively working on a fix. You can follow the progress on Moonbitlang.
#🏗️ Build Configuration
Modify the moon.pkg.json file in your project's root directory by adding the following configuration:
{
  "import": [
    {
      "path" : "Kaida-Amethyst/matplotlib",
      "alias" : "plt"
    }
  ],
  "link": {
    "native": {
      "cc": "$CC",
      "cc-flags": "$CC_FLAGS",
      "cc-link-flags": "$CC_LINK_FLAGS"
    }
  }
}#⚙️ Environment Variable Configuration
To enable Moonbit to interact correctly with Python, you need to configure some essential environment variables.
🐧🍎 Linux/macOS (env.sh):
#!/bin/bash
export PY_VERSION=$(python3 -c "import sys; print(f'{sys.version_info.major}.{sys.version_info.minor}')")
export CC=clang  # 🚀 We recommend using the clang compiler for better performance
export CC_FLAGS="-I$(python3-config --prefix)/include/python$PY_VERSION -O2 -DNDEBUG"
export CC_LINK_FLAGS="$(python3-config --ldflags) -lpython$PY_VERSION"
export C_INCLUDE_PATH="$(python3-config --prefix)/include/python$PY_VERSION:$C_INCLUDE_PATH"
Remember to execute this script in your shell:
source env.sh🪟 Windows PowerShell (env.ps1):
$PY_PATH = (python -c "import sys; print(sys.prefix)") | Out-String
$env:PY_VERSION = python -c "import sys; print(f'{sys.version_info.major}.{sys.version_info.minor}')"
$env:CC = "clang"
$env:CC_FLAGS = "-I$($PY_PATH.Trim())\include -O2 -DNDEBUG"
$env:CC_LINK_FLAGS = "-L$($PY_PATH.Trim())\libs -lpython$env:PY_VERSION"
Run this script in PowerShell:
. .\env.ps1#🚀 Quick Start
Let's draw a romantic heart curve using matplotlib.mbt!
let sin : (Double) -> Double = @math.sin
let cos : (Double) -> Double = @math.cos
const PI: Double = @math.PI

fn main {
  let n = 5000 // Number of data points
  let t : Array[Double] = Array::makei(n, fn (i) {2.0 * PI * i.to_double() / n.to_double()})
  let xs = t.map(fn (t) {16.0 * sin(t) * sin(t) * sin(t)})
  let ys = t.map(fn (t) {13.0 * cos(t) - 5.0 * cos(2.0 * t) - 2.0 * cos(3.0 * t) - cos(4.0 * t)})

  let (_, axes) = @plt.subplots(1, 1)
  let ax = axes[0][0]

  ax.plot(xs, ys, color=@plt.Red, linewidth=5)
  ax.set_title("Moonbit x Matplotlib")
  @plt.show()
}
Running this Moonbit code:
moon run main.mbt --target nativeIt will generate a beautiful heart-shaped plot, like this:
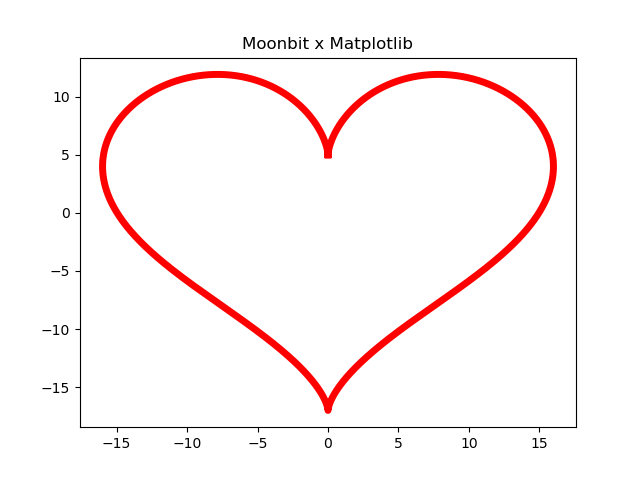
The equivalent Python code is as follows for your comparison:
import numpy as np
import matplotlib.pyplot as plt

n = 5000
t = np.linspace(0, 2 * np.pi, n)
x = 16 * np.sin(t)**3
y = 13 * np.cos(t) - 5 * np.cos(2*t) - 2 * np.cos(3*t) - np.cos(4*t)

fig, ax = plt.subplots()

ax.plot(x, y, color='red', linewidth = 5)
ax.set_title("Moonbit x Matplotlib")

plt.show()#🤝 Contributing
We warmly welcome your contributions to make matplotlib.mbt even better! You can contribute in the following ways:
- 🐛 Submit Issues to report any problems you encounter
- 🛠️ Submit Pull Requests to contribute your code improvements
- 📝 Enhance the documentation to help more people understand and use matplotlib.mbt
📜 License: Apache-2.0 License (see the LICENSE file for details)
#❤️ Matplotlib.mbt 🌙
#✨ 项目简介
matplotlib.mbt 是一个基于 python.mbt 的创新工具,它赋予开发者使用 Moonbit 语言操控强大的 Python 绘图库 Matplotlib 的能力。通过这种方式,我们可以充分利用 Moonbit 语言卓越的类型安全特性和现代化的语言生态,为数据可视化带来全新的体验。
#🛠️ 环境准备
在使用 matplotlib.mbt 之前,请确保你的开发环境已正确配置。
#🐍 Python 安装指南
重要提示:本项目要求 Python 3.9 或更高版本。为了获得最佳体验,我们强烈建议使用最新的稳定版本。
💡 推荐使用 Anaconda:对于数据科学和机器学习项目,我们强烈推荐安装 Anaconda。Anaconda 是一个包含了 Python、conda 包管理器以及众多常用数据科学库(如 NumPy, SciPy, Matplotlib 等)的发行版本,它可以帮助你更轻松地管理 Python 环境和依赖。
🐧 Linux (Debian/Ubuntu)
如果你不使用 Anaconda,请确保你的系统安装了 Python 3.9 或更高版本以及 Python 的开发文件。
sudo apt-get update && sudo apt-get install python3.13 python3.13-dev🍎 macOS (Homebrew)
brew install python@3.13🪟 Windows
- 访问 Python 官方网站
- 下载最新的 3.x 版本安装包
- 在安装过程中,请务必勾选 "Add Python to PATH" 选项
#📊 Matplotlib 安装
matplotlib.mbt 需要依赖 Python 的 Matplotlib 库。你可以使用 pip(Python 的包管理器)来安装它。
如果你没有安装 Anaconda,请打开你的终端或命令提示符并运行以下命令:
Bash
pip install matplotlib如果你使用了 Anaconda,Matplotlib 通常已经预装。如果未安装,你可以使用 conda 来安装:
Bash
conda install matplotlib#✅ 环境验证
验证你的 Python 版本以及获取 Python 开发头文件路径对于后续的配置至关重要。
# 检查 Python 版本
python3 --version

# 获取 Python 开发头文件路径
python3-config --prefix#⚙️ 项目配置
按照以下步骤配置你的 matplotlib.mbt 项目。
#📦 添加依赖
首先,更新你的包索引并安装 matplotlib 库:
moon update
moon add Kaida-Amethyst/matplotlib
⚠️ 请注意:当前 Moonbit 包管理器对纯 Native 库的支持可能存在一些已知问题,你可能会看到相关的错误提示。请暂时忽略这些提示,Moonbit 官方团队正在积极修复中,你可以关注 Moonbitlang 获取最新的进展。
#🏗️ 构建配置
修改你项目根目录下的 moon.pkg.json 文件,添加以下配置信息:
{
  "import": [
    {
      "path" : "Kaida-Amethyst/matplotlib",
      "alias" : "plt"
    }
  ],
  "link": {
    "native": {
      "cc": "$CC",
      "cc-flags": "$CC_FLAGS",
      "cc-link-flags": "$CC_LINK_FLAGS"
    }
  }
}#⚙️ 环境变量配置
为了让 Moonbit 能够正确地与 Python 交互,你需要配置一些必要的环境变量。
🐧🍎 Linux/macOS (env.sh):
#!/bin/bash
export PY_VERSION=$(python3 -c "import sys; print(f'{sys.version_info.major}.{sys.version_info.minor}')")
export CC=clang  # 🚀 推荐使用 clang 编译器以获得更佳的性能
export CC_FLAGS="-I$(python3-config --prefix)/include/python$PY_VERSION -O2 -DNDEBUG"
export CC_LINK_FLAGS="$(python3-config --ldflags) -lpython$PY_VERSION"
export C_INCLUDE_PATH="$(python3-config --prefix)/include/python$PY_VERSION:$C_INCLUDE_PATH"
记得在你的 shell 中执行这个脚本:
source env.sh🪟 Windows PowerShell (env.ps1):
$PY_PATH = (python -c "import sys; print(sys.prefix)") | Out-String
$env:PY_VERSION = python -c "import sys; print(f'{sys.version_info.major}.{sys.version_info.minor}')"
$env:CC = "clang"
$env:CC_FLAGS = "-I$($PY_PATH.Trim())\include -O2 -DNDEBUG"
$env:CC_LINK_FLAGS = "-L$($PY_PATH.Trim())\libs -lpython$env:PY_VERSION"
在 PowerShell 中运行此脚本:
. .\env.ps1#🚀 快速入门
让我们用 matplotlib.mbt 画一个浪漫的心形曲线吧!
let sin : (Double) -> Double = @math.sin
let cos : (Double) -> Double = @math.cos
const PI: Double = @math.PI

fn main {
  let n = 5000 // Number of data points
  let t : Array[Double] = Array::makei(n, fn (i) {2.0 * PI * i.to_double() / n.to_double()})
  let xs = t.map(fn (t) {16.0 * sin(t) * sin(t) * sin(t)})
  let ys = t.map(fn (t) {13.0 * cos(t) - 5.0 * cos(2.0 * t) - 2.0 * cos(3.0 * t) - cos(4.0 * t)})

  let (_, axes) = @plt.subplots(1, 1)
  let ax = axes[0][0]

  ax.plot(xs, ys, color=@plt.Red, linewidth=5)
  ax.set_title("Moonbit x Matplotlib")
  @plt.show()
}
运行这段 Moonbit 代码,使用下面的命令:
moon run main.mbt --target native你将会看到一个美丽的心形曲线图,就像这样:
等效的 Python 代码如下:
import numpy as np
import matplotlib.pyplot as plt

n = 5000
t = np.linspace(0, 2 * np.pi, n)
x = 16 * np.sin(t)**3
y = 13 * np.cos(t) - 5 * np.cos(2*t) - 2 * np.cos(3*t) - np.cos(4*t)

fig, ax = plt.subplots()

ax.plot(x, y, color='red', linewidth = 5)
ax.set_title("Moonbit x Matplotlib")

plt.show()#🤝 参与贡献
我们非常欢迎你的加入,一起让 matplotlib.mbt 变得更好!你可以通过以下方式参与贡献:
- 🐛 提交 Issue 报告你发现的问题
- 🛠️ 发起 Pull Request 贡献你的代码改进
- 📝 完善文档,让更多人了解和使用 matplotlib.mbt
📜 许可证:Apache-2.0 License(详细内容请查看 LICENSE 文件)
#Axes
pub struct Axes {
  // private fields
}#Axes::bar
Creates a bar plot on the axes. Each bar is centered at the x-coordinates
with the specified heights. Same as matplotlib.pyplot.bar in Python.
Parameters:
- self: The axes on which to create the bar plot.
- xs: An array of x-coordinates for the center of each bar.
- heights: An array of heights for each bar.
- width: The width of each bar. Defaults to 0.8.
- bottom: The y-coordinate of the bottom of each bar. Defaults to 0.0.
- color: The color of the bars. Defaults to blue.
Example:
test "Axes::bar" {
  let (fig, axes) = @matplotlib.subplots(1, 1)
  let x = [1.0, 2.0, 3.0]
  let heights = [4.0, 5.0, 6.0]
  axes[0][0].bar(x, heights, width=0.5, color=Red)
}#Axes::barh
#Axes::get_title
Gets the title text of the current axes. Provides the same functionality as
matplotlib.axes.Axes.get_title in Python.
Parameters:
- axes : The axes instance from which to retrieve the title.
Returns the current title text of the axes as a string.
Example:
///|
test "Axes::get_title" {
  let (fig, axes) = @matplotlib.subplots(1, 1)
  axes[0][0].set_title("My Plot")
  inspect!(axes[0][0].get_title(), content="\"My Plot\"")
}#Axes::get_xbound
Gets the x-axis bounds of the current axes.
Same as matplotlib.axes.Axes.get_xbound in Python.
Parameters:
- axes : The Axes instance to get the bounds from.
Returns a tuple of two Double values representing the lower and upper
bounds of the x-axis.
Example:
test "Axes::get_xbound" {
  let (fig, axes) = @matplotlib.subplots(1, 1)
  axes[0][0].set_xbound(-1.0, 1.0)
  let (lower, upper) = axes[0][0].get_xbound()
  inspect!((lower, upper), content="(-1.0, 1.0)")
}#Axes::get_xlabel
Gets the label text of the x-axis of the current axes. Provides the same
functionality as matplotlib.axes.Axes.get_xlabel in Python.
Parameters:
- axes: The axes instance from which to retrieve the x-axis label.
Returns the current x-axis label text as a string.
Example:
///|
test "Axes::get_xlabel" {
  let (fig, axes) = @matplotlib.subplots(1, 1)
  axes[0][0].set_xlabel("X Label")
  inspect!(axes[0][0].get_xlabel(), content="\"X Label\"")
}#Axes::get_xlim
Gets the x-axis limits of the current axes. Same as matplotlib.axes.Axes.get_xlim in Python.
Parameters:
- self : The Axes instance to get the limits from.
Returns a tuple of two Double values representing the left and right limits
of the x-axis.
Example:
test "Axes::get_xlim" {
  let (fig, axes) = @matplotlib.subplots(1, 1)
  axes[0][0].set_xlim(-1.0, 1.0)
  let (left, right) = axes[0][0].get_xlim()
  inspect!((left, right), content="(-1.0, 1.0)")
}#Axes::get_ybound
Gets the y-axis bounds of the current axes. Same as
matplotlib.axes.Axes.get_ybound in Python.
Parameters:
- axes : The Axes instance to get the bounds from.
Returns a tuple of two Double values representing the lower and upper
bounds of the y-axis.
Example:
///|
test "Axes::get_ybound" {
  let (fig, axes) = @matplotlib.subplots(1, 1)
  axes[0][0].set_ybound(-1.0, 1.0)
  let (lower, upper) = axes[0][0].get_ybound()
  inspect!((lower, upper), content="(-1.0, 1.0)")
}#Axes::get_ylabel
Gets the label text of the y-axis of the current axes. Provides the same
functionality as matplotlib.axes.Axes.get_ylabel in Python.
Parameters:
- axes: The axes instance from which to retrieve the y-axis label.
Returns the current y-axis label text as a string.
Example:
///|
test "Axes::get_ylabel" {
  let (fig, axes) = @matplotlib.subplots(1, 1)
  axes[0][0].set_ylabel("Y Label")
  inspect!(axes[0][0].get_ylabel(), content="\"Y Label\"")
}#Axes::get_ylim
Gets the y-axis limits of the current axes.
Same as matplotlib.axes.Axes.get_ylim in Python.
Parameters:
- self : The Axes instance to get the limits from.
Returns a tuple of two Double values representing the bottom and top limits
of the y-axis.
Example:
test "Axes::get_ylim" {
  let (fig, axes) = @matplotlib.subplots(1, 1)
  axes[0][0].set_ylim(-1.0, 1.0)
  let (bottom, top) = axes[0][0].get_ylim()
  inspect!((bottom, top), content="(-1.0, 1.0)")
}#Axes::grid
#Axes::hline
#Axes::pie
Creates a pie chart on the axes. Each data point in values represents a
wedge of the pie, and the size of each wedge is determined by the relative
value with respect to the sum of all values.
Same as matplotlib.pyplot.pie in Python.
Parameters:
- self : The axes on which to create the pie chart.
- values : An array of numerical values that determine the size of each wedge.
- labels : Optional array of strings to label each wedge. Must have the same length as values if provided.
- colors : Optional array of colors for each wedge. Must have the same length as values if provided.
Example:
test "Axes::pie" {
  let (fig, axes) = @matplotlib.subplots(1, 1)
  let values = [35.0, 25.0, 40.0]
  let labels = ["A", "B", "C"]
  let colors = [
    @matplotlib.Color::Red,
    @matplotlib.Color::Green,
    @matplotlib.Color::Blue,
  ]
  axes[0][0].pie(values, labels~, colors~)
}#Axes::plot
Plot y versus x as lines and/or markers. Same as matplotlib.pyplot.plot in Python.
Arguments
- xs: x-coordinates of the points to plot.
- ys: y-coordinates of the points to plot.
Optional Arguments
- format: A format string that specifies the color and line style of the plot. Default is "r" (red line).
- label: A label for the plot, used in the legend. Default is None.
- linewidth: The width of the line. Default is 1.0.
- linestyle: The style of the line. Default is solid line.
- alpha: The transparency of the plot. Default is 1.0 (opaque).
(To be added later)
#Axes::scatter
Creates a scatter plot on the axes. Each data point is represented by a
marker at the coordinates specified by x and y arrays.
Same as matplotlib.pyplot.scatter in Python.
Parameters:
- self: The axes on which to create the scatter plot.
- xs: An array of x-coordinates for the data points.
- ys: An array of y-coordinates for the data points.
- color: The color of the markers. Defaults to blue.
- marker: The style of the markers. Defaults to circle ('o').
- alpha: The transparency level of the markers, ranging from 0.0 (transparent) to 1.0 (opaque). Defaults to 1.0.
Example:
test "Axes::scatter" {
  let (fig, axes) = @matplotlib.subplots(1, 1)
  let x = [1.0, 2.0, 3.0]
  let y = [4.0, 5.0, 6.0]
  axes[0][0].scatter(x, y, color=Red, marker=Star, alpha=0.5)
}#Axes::set_title
Sets the title of the axes. Provides the same functionality as
matplotlib.axes.Axes.set_title in Python.
Parameters:
- self : The axes instance to set the title for.
- title : The text to be displayed as the title of the axes.
Example:
///|
test "Axes::set_title" {
  let (fig, axes) = @matplotlib.subplots(1, 1)
  axes[0][0].set_title("My Plot")
  inspect!(axes[0][0].get_title(), content="\"My Plot\"")
}#Axes::set_xbound
Sets the x-axis bounds of the current axes.
Same as matplotlib.axes.Axes.set_xbound in Python.
Parameters:
- self : The axes instance to set the bounds for.
- lower : The lower bound of the x-axis.
- upper : The upper bound of the x-axis.
Example:
test "Axes::set_xbound" {
  let (fig, axes) = @matplotlib.subplots(1, 1)
  axes[0][0].set_xbound(-1.0, 1.0)
  let (lower, upper) = axes[0][0].get_xbound()
  inspect!((lower, upper), content="(-1.0, 1.0)")
}#Axes::set_xlabel
Set the label for the x-axis. Same as matplotlib.axes.Axes.set_xlabel in Python.
Arguments
- xlabel: The label string for the x-axis.
#Axes::set_xlim
Set the x-axis view limits. Same as matplotlib.axes.Axes.set_xlim in Python.
Arguments
- left: The left limit of the x-axis.
- right: The right limit of the x-axis.
#Axes::set_ybound
Sets the y-axis bounds of the current axes.
Same as matplotlib.axes.Axes.set_ybound in Python.
Parameters:
- axes : The Axes instance to set the bounds for.
- lower : The lower bound of the y-axis.
- upper : The upper bound of the y-axis.
Example:
///|
test "Axes::set_ybound" {
  let (fig, axes) = @matplotlib.subplots(1, 1)
  axes[0][0].set_ybound(-1.0, 1.0)
  let (lower, upper) = axes[0][0].get_ybound()
  inspect!((lower, upper), content="(-1.0, 1.0)")
}#Axes::set_ylabel
Set the label for the y-axis. Same as matplotlib.axes.Axes.set_ylabel in Python.
Arguments
- ylabel: The label string for the y-axis.
#Axes::set_ylim
Set the y-axis view limits. Same as matplotlib.axes.Axes.set_ylim in Python.
Arguments
- bottom: The bottom limit of the y-axis.
- top: The top limit of the y-axis.
#Axes::stem
#Axes::text
#Color
pub(all) enum Color {
  Aliceblue
  Antiquewhite
  Aqua
  Aquamarine
  Azure
  Beige
  Bisque
  Black
  Blanchedalmond
  Blue
  Blueviolet
  Brown
  Burlywood
  Cadetblue
  Chartreuse
  Chocolate
  Coral
  Cornflowerblue
  Cornsilk
  Crimson
  Cyan
  Darkblue
  Darkcyan
  Darkgoldenrod
  Darkgray
  Darkgreen
  Darkgrey
  Darkkhaki
  Darkmagenta
  Darkolivegreen
  Darkorange
  Darkorchid
  Darkred
  Darksalmon
  Darkseagreen
  Darkslateblue
  Darkslategray
  Darkslategrey
  Darkturquoise
  Darkviolet
  Deeppink
  Deepskyblue
  Dimgray
  Dimgrey
  Dodgerblue
  Firebrick
  Floralwhite
  Forestgreen
  Fuchsia
  Gainsboro
  Ghostwhite
  Gold
  Goldenrod
  Gray
  Green
  Greenyellow
  Grey
  Honeydew
  Hotpink
  Indianred
  Indigo
  Ivory
  Khaki
  Lavender
  Lavenderblush
  Lawngreen
  Lemonchiffon
  Lightblue
  Lightcoral
  Lightcyan
  Lightgoldenrodyellow
  Lightgray
  Lightgreen
  Lightgrey
  Lightpink
  Lightsalmon
  Lightseagreen
  Lightskyblue
  Lightslategray
  Lightslategrey
  Lightsteelblue
  Lightyellow
  Lime
  Limegreen
  Linen
  Magenta
  Maroon
  Mediumaquamarine
  Mediumblue
  Mediumorchid
  Mediumpurple
  Mediumseagreen
  Mediumslateblue
  Mediumspringgreen
  Mediumturquoise
  Mediumvioletred
  Midnightblue
  Mintcream
  Mistyrose
  Moccasin
  Navajowhite
  Navy
  Oldlace
  Olive
  Olivedrab
  Orange
  Orangered
  Orchid
  Palegoldenrod
  Palegreen
  Paleturquoise
  Palevioletred
  Papayawhip
  Peachpuff
  Peru
  Pink
  Plum
  Powderblue
  Purple
  Rebeccapurple
  Red
  Rosybrown
  Royalblue
  Saddlebrown
  Salmon
  Sandybrown
  Seagreen
  Seashell
  Sienna
  Silver
  Skyblue
  Slateblue
  Slategray
  Slategrey
  Snow
  Springgreen
  Steelblue
  Tan
  Teal
  Thistle
  Tomato
  Turquoise
  Violet
  Wheat
  White
  Whitesmoke
  Yellow
  Yellowgreen
  Rgb(Int, Int, Int)
}#Figure
pub struct Figure {
  // private fields
}#LineStyle
pub(all) enum LineStyle {
  Solid
  Dashed
  Dotted
  DashDot
}#Marker
pub(all) enum Marker {
  Point
  Pixel
  Circle
  Octagon
  Square
  Pentagon
  Plus
  PlusFilled
  Star
  Hexagon1
  Hexagon2
  X
  XFilled
  Diamond
  ThinDiamond
  Vline
  Hline
  TriangleUp
  TriangleDown
  TriangleLeft
  TriangleRight
  TriDown
  TriUp
  TriLeft
  TriRight
}#MatplotlibError
pub enum MatplotlibError {
  LoadPyPlotError
  LoadPylabError
  LoadFuncError(String)
}
impl Show for MatplotlibError
automatically derived
Draw scientific plots with matplotlib in moonbit

 0.1.2
0.1.2 Apache-2.0
 Updated last year
 28 downloads
Dependencies